

Turn PowerPoint Slides Into Professional Infographics
Transform presentation slides, research, statistics, and key takeaways into clear, engaging visual content with our AI-powered PowerPoint to Infographic Converter.
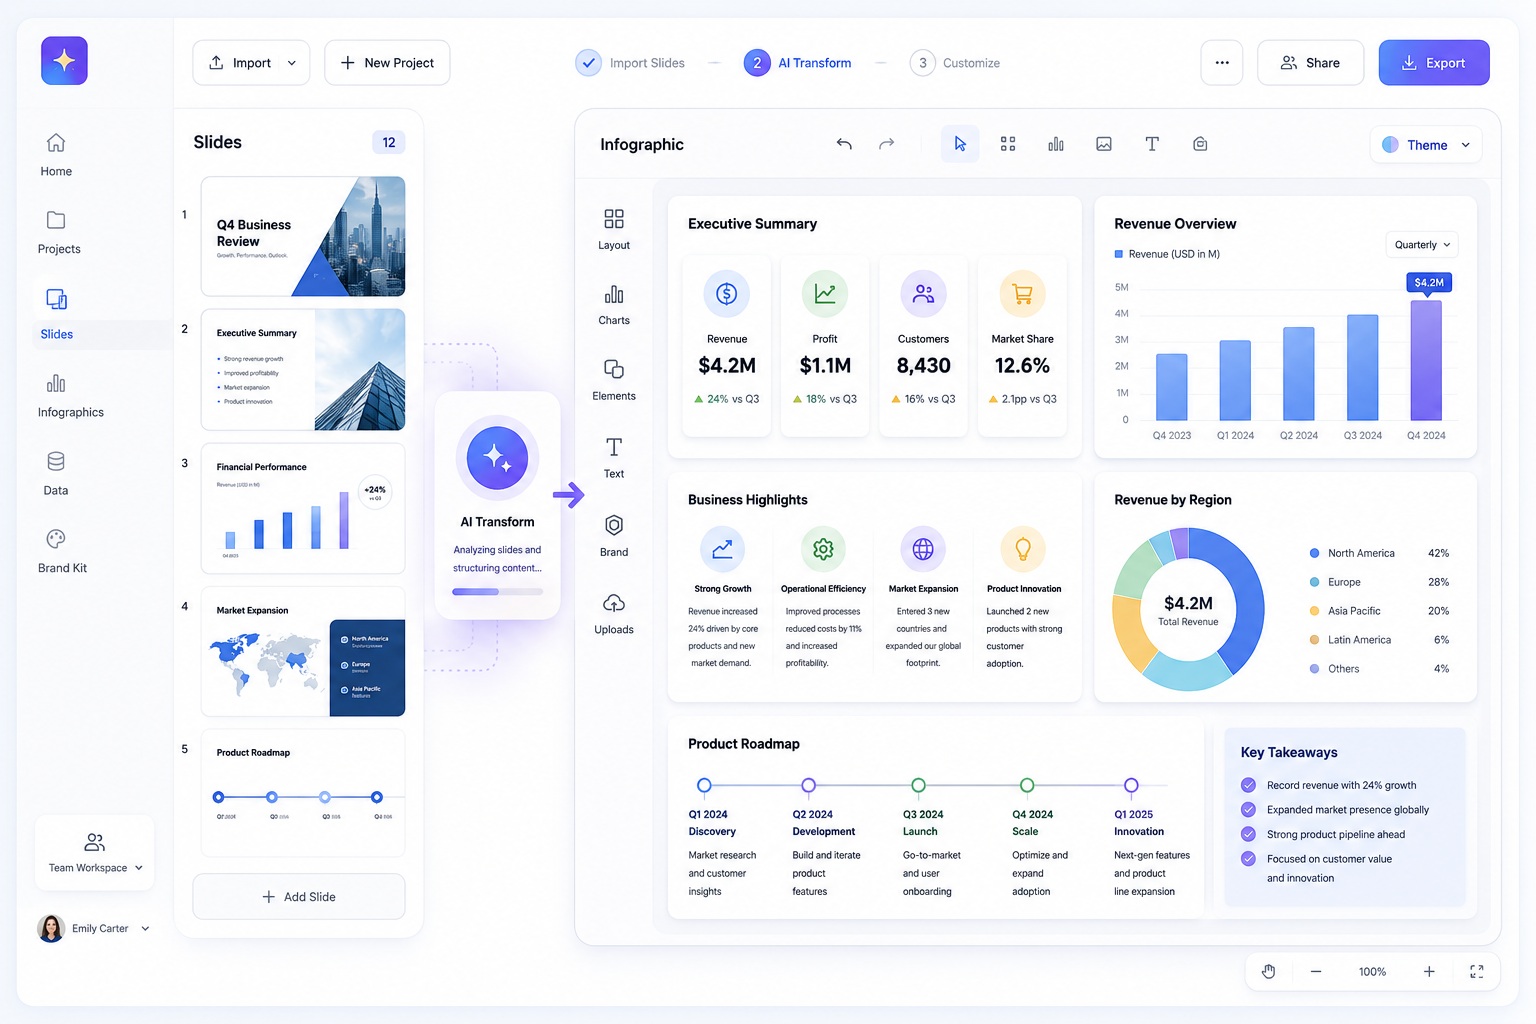
Give Your Presentation Content a More Visual Format
PowerPoint presentations often contain valuable information, but long slide decks can be difficult to share outside a meeting. Important statistics, recommendations, timelines, processes, and conclusions may be spread across multiple slides. Your audience must move through the entire presentation to understand the complete message.
Infographic Maker AI helps you convert PowerPoint content into a more focused visual story. The platform organizes your presentation information into a clear hierarchy, highlights the main ideas, and creates an editable infographic layout. You can then refine the copy, rearrange sections, add charts, change colors, and customize the design before publishing.
Instead of rebuilding your presentation manually, begin with a polished visual draft.

Turn Multiple Slides Into One Clear Visual Story
A PowerPoint presentation is designed to be viewed one slide at a time. An infographic presents the complete story in one connected visual experience. Converting PowerPoint content into an infographic can help you:
The PowerPoint to Infographic Converter gives you a faster starting point while keeping you in control of the final design.
How to Convert PowerPoint to Infographic
Create a professional infographic from your presentation content in four straightforward steps.
Add Your PowerPoint Content
Upload your available source material or bring in the text, data, headings, and key points from your presentation. You can use a complete presentation, selected slides, speaker notes, or a summary of the information you want to visualize.
Generate a Visual Structure
AI analyzes the content, identifies the main message, and organizes supporting information into a logical visual flow. It can structure your information as a list, process, comparison, timeline, report, data story, or another suitable infographic format.
Customize Your Infographic
Review the generated draft and refine every important element. Edit the text, rearrange sections, add icons, update charts, replace images, adjust typography, and apply your preferred colors and branding.
Export and Share
Export the completed infographic for use on websites, social media, reports, presentations, email campaigns, classrooms, and client projects.
Why Convert PowerPoint Content Into an Infographic?
Make Information Easier to Scan
Turn presentation content into clear visual sections that help readers identify key points without reviewing every individual slide.
Create a Shareable Summary
Give your audience a single visual asset they can download, publish, share, or reference after a meeting or presentation.
Save Design Time
Generate a structured first draft without manually copying every slide into a new design or arranging individual content blocks.
Highlight Important Insights
Give more visual emphasis to essential statistics, recommendations, conclusions, milestones, and business results.
Repurpose Existing Work
Get more value from presentations you have already created by adapting their content for new platforms and audiences.
Maintain Creative Control
Use AI to accelerate the initial conversion while keeping the text, layout, charts, colors, images, and branding editable.
Convert Different Types of PowerPoint Presentations
The PowerPoint to Infographic Converter can help transform many types of presentation content into polished visuals.
Business Presentations
Summarize strategies, company updates, performance information, operational plans, and executive recommendations.
Sales Presentations
Turn product benefits, customer problems, sales processes, comparisons, and results into a concise sales infographic.
Marketing Presentations
Repurpose campaign plans, audience research, marketing funnels, content strategies, and performance reports.
Educational Presentations
Convert lessons, lectures, research, historical information, and scientific topics into engaging learning materials.
Research Presentations
Present methodologies, findings, statistics, observations, and conclusions through a structured visual summary.
Project Presentations
Visualize project objectives, responsibilities, workflows, milestones, risks, and expected outcomes.
Training Presentations
Transform procedures, policies, onboarding information, and instructional slides into easy-to-follow visual guides.
Data Presentations
Convert important metrics, trends, survey results, and performance indicators into charts and visual callouts.
Choose a Visual Format That Fits Your Presentation
Not every slide deck should become the same type of infographic. AI can help organize the content into a format that matches the message.
Presentation Summary
Condense the central message, supporting points, and conclusion into a clear visual overview.
Process Infographic
Turn instructional slides or workflows into a connected sequence of steps.
Timeline Infographic
Arrange dates, milestones, project phases, or historical events in chronological order.
Comparison Infographic
Present differences between products, strategies, plans, features, or competing ideas.
Data Infographic
Transform statistics and performance information into charts, KPI blocks, and visual highlights.
List Infographic
Organize recommendations, benefits, findings, tips, or important takeaways into a scannable layout.
Report Infographic
Summarize business, research, financial, marketing, or project reports contained within a presentation.
Educational Infographic
Simplify complex lesson material into visual sections that support faster understanding and recall.
Everything You Need to Transform Slides Into Visual Content
AI Content Structuring
Identify important ideas across your presentation and organize them into a clearer narrative hierarchy.
Smart Layout Generation
Generate an infographic structure based on your content instead of forcing the information into an unsuitable generic layout.
Fully Editable Sections
Revise headings, shorten descriptions, remove unnecessary content, duplicate blocks, and rearrange sections.
Charts & Data Visualization
Present data through bar charts, line charts, pie charts, donut charts, comparisons, timelines, and KPI blocks.
Icons & Images
Use icons, illustrations, images, shapes, and visual callouts to make important information easier to understand.
Brand Customization
Apply your logo, brand colors, preferred typography, and reusable visual elements to the infographic.
Flexible Resizing
Adapt the completed design for social media, websites, reports, presentations, documents, and other channels.
Multiple Export Options
Prepare high-quality files for digital publishing, professional communication, printing, or continued presentation use.
Get More Value From Every Presentation
Your PowerPoint presentation does not need to remain limited to meetings and slide-show formats. One presentation can be transformed into:
The PowerPoint to infographic workflow helps you reuse existing information without starting the content-creation process again.
Repurpose My PowerPoint
Built for Presentations Across Every Team
Marketing Teams
Convert strategy decks, campaign reports, audience insights, and performance presentations into shareable visual content.
Sales Teams
Turn sales presentations into product explainers, comparison graphics, process visuals, and customer-facing summaries.
Educators
Transform classroom presentations and lecture slides into visual learning materials, revision guides, and handouts.
Consultants
Convert findings, frameworks, audits, workshop presentations, and recommendations into client-ready infographic summaries.
Product Teams
Visualize product roadmaps, feature comparisons, user journeys, launch plans, and research findings.
HR Teams
Repurpose onboarding, training, hiring, policy, and employee-development presentations.
Analysts
Transform performance metrics, research results, survey findings, and data presentations into understandable visual reports.
Nonprofits
Convert awareness presentations, campaign information, research, and impact reports into engaging public-facing visuals.
PowerPoint Presentation vs. Infographic
- Presents information across multiple slides
- Commonly used during meetings and speeches
- Often requires a presenter or additional explanation
- May be difficult to review quickly
- Usually shared as a complete presentation file
- Connects important information in one visual
- Can be understood without a live presenter
- Highlights the most important ideas
- Is easier to scan and share
- Can be published across multiple platforms
You do not need to replace every presentation with an infographic. Instead, use an infographic to summarize, promote, explain, or extend the value of your PowerPoint content.
Why Use Infographic Maker AI?
Faster First Drafts
Move from presentation content to a structured infographic direction without rebuilding every element from a blank canvas.
Clearer Visual Hierarchy
Organize headings, supporting information, data, and conclusions in a sequence that is easier to follow.
Editable Results
Change the text, charts, icons, images, colors, typography, sections, and layout before publishing.
Brand-Ready Designs
Customize the visual style to support your company, school, organization, campaign, product, or client.
Multiple Publishing Options
Use the completed infographic online, in reports, across social media, or inside a new presentation.
Designed for Real Communication
Create useful visual summaries, explainers, reports, timelines, comparisons, processes, and educational resources.
Frequently Asked Questions
Convert Your PowerPoint Into an Infographic
Do not let valuable information remain buried inside a long slide deck.
Use Infographic Maker AI to identify the key message, organize presentation content, and create an editable infographic that your audience can understand and share.
Bring your presentation, important slides, statistics, or key takeaways. AI will help you transform them into a polished visual story.