


Click any AI tool above to instantly get a summary of this article. Perfect for quick insights when you're short on time.
Why are infographics effective? The answer lies in their ability to turn complex, overwhelming information into clear, engaging visual stories. In today’s fast-paced digital environment, audiences are constantly bombarded with content. As a result, attention spans are shorter than ever. Infographics solve this problem by combining data, visuals, and storytelling into a format that is easy to understand and quick to consume.
Infographics are not just visually appealing—they are strategic communication tools. They help businesses, educators, marketers, and researchers present information in a way that captures attention, improves comprehension, and increases retention. Whether used for marketing campaigns, educational materials, or data presentations, infographics consistently outperform text-heavy content.
In this comprehensive guide, we will explore why infographics are so effective, how they influence engagement and memory, the psychology behind their success, common mistakes to avoid, and how you can create powerful infographics that deliver real results.
Why Are Infographics Effective For Simplifying Complex Information?
One of the primary reasons infographics are effective is their ability to simplify complex information. Instead of forcing readers to process long paragraphs or dense reports, infographics break information into digestible visual segments.
Humans process visuals significantly faster than text. When information is presented through charts, icons, diagrams, and structured layouts, it becomes easier to understand patterns, relationships, and key insights. This is especially important when dealing with data-heavy topics such as statistics, research findings, or technical explanations.
Infographics also use visual hierarchy to guide the reader. Important information is highlighted through size, color, and placement, allowing viewers to quickly grasp the main message without confusion. This structured flow ensures that readers can follow the content logically from start to finish.
Businesses frequently use infographics to present financial reports, product comparisons, and customer insights. Educational institutions rely on them to explain scientific concepts, historical timelines, and learning materials. In both cases, the goal is the same—make complex information accessible.
Modern tools have made infographic creation more efficient than ever. Platforms that help you produce unbelievable infographics from ideas allow users to transform raw data into polished visuals without requiring advanced design skills.
Must-know Tip: The most effective infographics focus on clarity, not quantity. Avoid overloading your design with unnecessary details.
How Infographics Improve Engagement, Retention, And Content Performance
Infographics are highly effective because they significantly improve user engagement. In a digital landscape where users scroll quickly, visual content stands out and encourages people to pause and interact.
Studies and marketing trends from 2024 to 2026 show that visual content consistently outperforms text-based content in terms of engagement. Infographics are particularly powerful because they combine visual appeal with valuable information.
They are also highly shareable. On social media platforms, users are more likely to share content that is easy to understand and visually appealing. Infographics meet both criteria, making them ideal for increasing reach and visibility.
Another key advantage is improved retention. When information is presented visually, it is easier for the brain to store and recall. This is especially useful for educational content, training materials, and marketing messages that need to leave a lasting impression.
For example, a company presenting growth metrics through a visual timeline can communicate progress more effectively than a spreadsheet. Similarly, a healthcare infographic explaining preventive measures can help audiences remember critical information more easily.
Infographics also support SEO and content marketing strategies. They can attract backlinks, increase time on page, and enhance overall content performance.
Must-know Tip: Focus each infographic on one core message. Trying to cover too many topics reduces clarity and impact.
The Role Of Design Psychology In Creating Effective Infographics
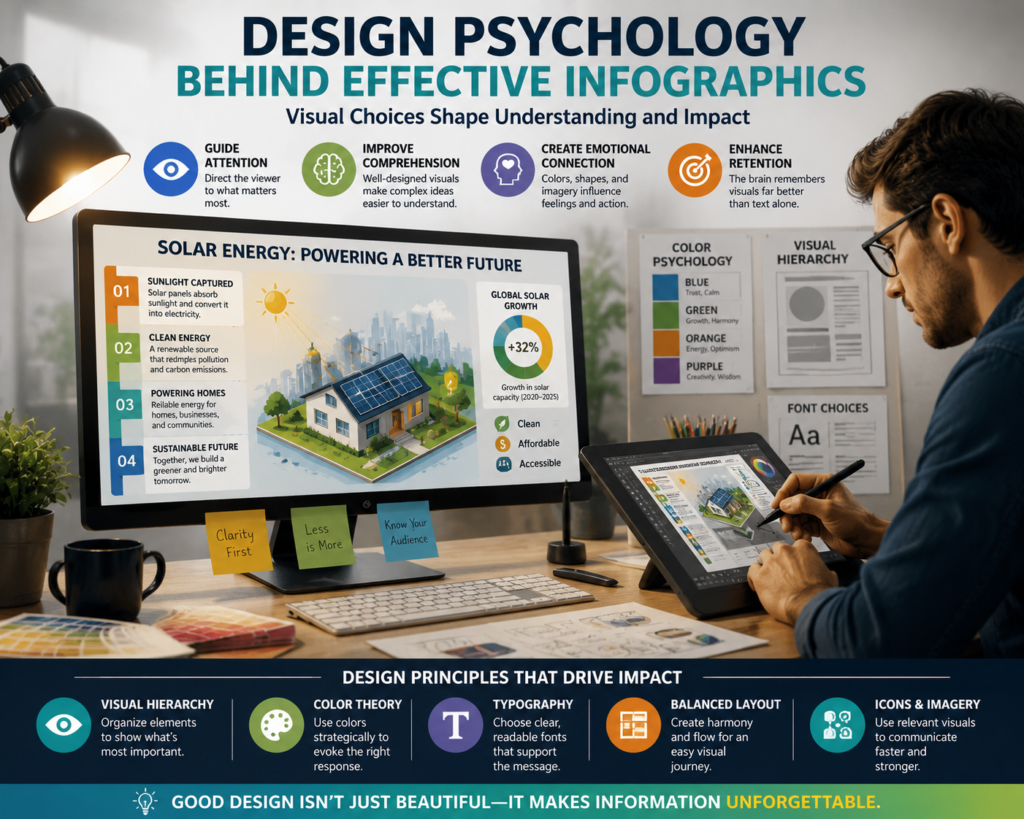
Design psychology plays a crucial role in determining the effectiveness of an infographic. A visually appealing design is not enough—it must also support comprehension.
Color is one of the most powerful design elements. Different colors evoke different emotions and influence how information is perceived. For example, blue often conveys trust, while red can signal urgency. However, excessive use of color can overwhelm the viewer.
Typography is equally important. Clear, readable fonts ensure that the message is accessible. Proper spacing and hierarchy help guide the reader through the content without confusion.
Visual hierarchy is essential for directing attention. The most important information should stand out immediately, while supporting details should be secondary. This ensures that readers can quickly identify key points.
Layout and structure also matter. A well-organized infographic should feel intuitive, allowing viewers to navigate the content effortlessly.
Current design trends from 2024 to 2026 emphasize minimalism, mobile optimization, and interactive elements. These trends reflect the growing need for clean, user-friendly designs that work across all devices.
Must-know Tip: If your design distracts from the message, it is not effective. Simplicity always wins.
How Businesses Use Infographics For Marketing And Brand Growth
Businesses use infographics as powerful marketing tools because they communicate value quickly and effectively. In competitive markets, the ability to deliver clear and memorable messages is essential.
Marketing teams use infographics to explain products, showcase industry trends, present research findings, and educate customers. These visuals help simplify decision-making for potential buyers.
Infographics also strengthen brand identity. Consistent use of colors, fonts, and visual styles helps build recognition and trust. When audiences repeatedly encounter valuable content from a brand, they are more likely to remember and engage with it.
From an SEO perspective, infographics can drive traffic and improve visibility. High-quality visuals are often shared and referenced by other websites, generating backlinks and increasing authority.
Infographics are versatile and can be used across multiple industries. Technology companies use them for product explanations, financial firms use them for reports, and nonprofits use them for awareness campaigns.
Must-know Tip: Always prioritize value over promotion. Informative content builds trust, while overly promotional content drives audiences away.
Common Mistakes That Reduce Infographic Effectiveness
Despite their advantages, infographics can fail if not executed properly. Many ineffective designs prioritize aesthetics over clarity.
One of the most common mistakes is overcrowding. Trying to include too much information in a single infographic can overwhelm the viewer and reduce comprehension.
Another issue is poor data quality. Using outdated or unreliable information can damage credibility, regardless of how visually appealing the design is.
Lack of structure is another problem. If readers cannot quickly identify the main message, they are likely to lose interest.
Mobile optimization is often overlooked. Since a large portion of users access content on smartphones, infographics must be designed for smaller screens.
Other common mistakes include:
• Using irrelevant or decorative visuals
• Choosing hard-to-read fonts
• Creating misleading charts
• Ignoring the target audience
• Failing to include a clear takeaway
The most effective infographics strike a balance between design and information. They are visually appealing, accurate, and easy to understand.
Must-know Tip: Test your infographic with someone unfamiliar with the topic. If they understand it quickly, your design is effective.
How To Create An Effective Infographic Step By Step
Creating a successful infographic requires a structured approach. It is not just about design—it is about communication.
Define Your Goal And Audience
Start by identifying the purpose of your infographic. Are you educating, informing, or persuading? Understanding your audience will help you tailor the content and design.
Collect And Organize Reliable Information
Gather accurate data and organize it into key points. Remove unnecessary details to maintain clarity.
Choose The Right Visual Format
Different types of infographics serve different purposes:
• Statistical infographics for data visualization
• Timeline infographics for chronological information
• Process infographics for step-by-step explanations
• Comparison infographics for highlighting differences
Design For Clarity
Use clean layouts, readable fonts, and balanced visuals. Ensure that the design supports the message rather than distracting from it.
Measure Performance
After publishing, analyze engagement metrics such as shares, traffic, and user interaction. Use this data to improve future designs.
Must-know Tip: Think of your infographic as a visual story. Every element should contribute to the narrative.
The Future Of Infographics In Digital Communication
The future of infographics is evolving rapidly with advancements in technology. As digital communication continues to grow, infographics are becoming more interactive, personalized, and data-driven.
Artificial intelligence is playing a significant role in this transformation. AI-powered tools can assist with layout design, data visualization, and content generation, making infographic creation faster and more accessible.
Interactive infographics are also gaining popularity. These allow users to engage with content by exploring data, clicking elements, and customizing views. This level of interaction enhances user experience and increases engagement.
Mobile-first design will remain a priority. As more users consume content on smartphones, infographics must be optimized for smaller screens without losing clarity.
The demand for visual communication will continue to rise. As information becomes more complex, the need for simple, effective explanations will grow.
Conclusion
Infographics are effective because they combine visual storytelling with structured information to create content that is easy to understand, engaging, and memorable. They simplify complex ideas, improve retention, and enhance communication across industries.
From marketing and education to research and business reporting, infographics provide a powerful way to deliver information quickly and effectively. When designed correctly, they can significantly improve engagement, boost SEO performance, and strengthen brand authority.
As digital communication continues to evolve, infographics will remain an essential tool for anyone looking to communicate clearly and effectively. By focusing on clarity, accuracy, and audience needs, you can create infographics that truly make an impact.
Frequently Asked Questions
1. Why are infographics effective for communication?
Infographics are effective because they present information visually, making it easier to understand and process quickly.
2. Why do people remember infographics better than text?
Visual content helps the brain form stronger connections, improving memory and recall.
3. Are infographics useful for SEO?
Yes, they can increase engagement, attract backlinks, and improve overall content performance.
4. What makes an infographic successful?
A successful infographic combines accurate data, clear design, and a focused message.
5. Are infographics still relevant in 2026?
Yes, visual content continues to dominate digital communication and remains highly effective.
6. What industries benefit from infographics?
Industries such as marketing, education, healthcare, finance, and technology all benefit from infographics.
7. How long should an infographic be?
It should be long enough to convey the message clearly but concise enough to maintain attention.
8. Can AI help create infographics?
Yes, AI tools can assist with design, layout, and data visualization.
9. What are common infographic mistakes?
Common mistakes include overcrowding, poor data quality, and lack of structure.
10. Are infographics good for social media?
Yes, they are highly shareable and perform well on social platforms.

Comments
0 responsesNo comments yet. Be the first to share your thoughts.