


Click any AI tool above to instantly get a summary of this article. Perfect for quick insights when you're short on time.
The Best Infographic Maker AI can turn a rough idea, report, dataset, or document into a visual story without forcing you to design every element manually. That matters more than ever. In HubSpot’s 2026 marketing research, 80% of marketers said they use AI for content creation and 75% use it for media production. Canva’s 2025 Visual Communication Report also estimates that $143 billion is invested annually in the U.S. visual content economy.
But AI infographic tools are not equal. Some excel at data visualization. Others prioritize templates, branding, interactive content, or rapid text-to-visual generation. This guide compares seven strong options, their real features, costs, strengths, and limitations so you can choose with confidence.
What Can You Turn Into an Infographic? PDF, Word, CSV, URLs and More
Common Inputs AI Infographic Tools Can Handle
Modern AI infographic tools can start with much more than a one-sentence prompt. Depending on the platform, you can work from reports, PDFs, Word documents, presentations, spreadsheets, plain text, structured datasets, URLs, or existing visual material.
That flexibility matters because most useful business information already exists somewhere. You may have survey results in a CSV file, a research report in PDF format, campaign findings in a document, or performance figures inside a spreadsheet. Instead of rebuilding everything manually, a capable AI tool can help reorganize the material into a clearer visual hierarchy.
The adoption trend is already strong. Canva’s 2024 Visual Economy Report found that 82% of surveyed business leaders had used AI-powered tools to produce visual content during the previous year. It also found that 77% believed visual communication had improved business performance.
Different platforms support different inputs. Piktochart, for example, supports PDF, DOCX, and TXT uploads for its AI infographic workflow. Venngage lets you start with text or upload content such as documents and CSV data. Napkin AI supports PPT, DOC, PDF, HTML, and Markdown imports. Gamma supports PDF and PPTX imports.
The real question is therefore not simply, “Can this tool make an infographic?” Ask whether it can work with the material you already have.
Must-know Tip: Edward Tufte’s famous rule is simple: “Above all else, show the data.” Your input format matters less than whether the final visual makes the important information easier to understand.
Canva’s 2024 research also found that 92% of surveyed leaders expected employees outside design roles to possess at least some design ability. AI tools are helping close that skills gap by reducing the amount of manual layout work required.
How to Write Better Prompts for AI-Generated Infographics
A weak prompt usually creates a generic infographic. A strong prompt gives the AI enough information to understand your audience, purpose, hierarchy, facts, preferred visual format, and desired outcome.
Don’t write only, “Create an infographic about email marketing.” Give the AI direction.
A stronger prompt could say:
“Create a vertical infographic for small ecommerce businesses explaining five ways to improve email conversion rates. Use a short introduction, five numbered sections, one comparison chart, concise supporting copy, and a final takeaway. Keep the language professional and easy for non-marketers to understand.”
The difference is specificity.
A useful infographic prompt should identify:
- The main topic
- Target audience
- Primary goal
- Key facts or data
- Desired sections
- Suitable charts or diagrams
- Tone
- Length
- Visual hierarchy
- Intended channel, such as a blog, report, presentation, or social post
Venngage itself recommends defining your objective, audience, key insights, data points, visual style, and relevant charts when prompting its data infographic generator.
AI can speed up visual production, but human review still matters. Canva’s 2024 research found that 90% of surveyed business leaders believed generative AI had improved visual communication quality, while 73% said AI tools enhanced team productivity. However, 70% were concerned about copyright infringement, another 70% about accidentally sharing sensitive information, and 68% about AI bias.
So verify every statistic, label, date and conclusion before publishing.
Must-know Tip: Cole Nussbaumer Knaflic writes, “The story should ultimately be about your audience, not about you.” Give your AI tool enough audience context to choose information and visuals that actually serve the reader.
Your first generation should be treated as a draft. Refine the hierarchy, remove unnecessary copy, correct questionable facts and regenerate weak sections instead of accepting everything automatically.
7 Best Infographic Maker AI Tools
The best infographic maker AI isn’t necessarily the platform with the longest feature list. You need a tool that reduces actual work. That means turning information into usable visuals, keeping layouts editable, handling data correctly, supporting your brand, and exporting the finished design in formats you can use.
AI is already reducing production friction. Content Marketing Institute research found that 51% of B2B marketers using generative AI reported fewer tedious tasks, while 45% reported more efficient workflows.
Here are seven tools worth comparing.
1. Infographicmakerai

Infographicmakerai takes a content-first approach. You can paste notes, a report, a brief, data, or a simple idea and use AI to structure that information into a visual story. Instead of beginning with a blank canvas, you start with the information you need to communicate.
Its AI Content to Visual workflow is particularly useful when your source material is messy. The system creates a first draft, organizes the narrative and lets you regenerate individual sections instead of forcing you to rebuild the entire infographic. That can save time when only one part of an otherwise useful design needs changing.
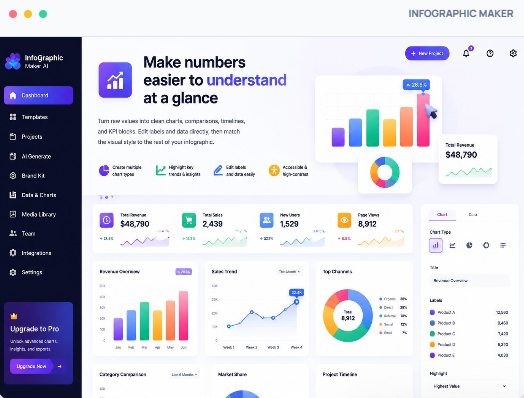
The Smart Editor adds another practical layer. It provides layout and spacing suggestions, auto-alignment, snap-to-grid controls, version history and real-time previews. You therefore keep control after AI creates the first version rather than receiving a flattened image you cannot meaningfully edit.
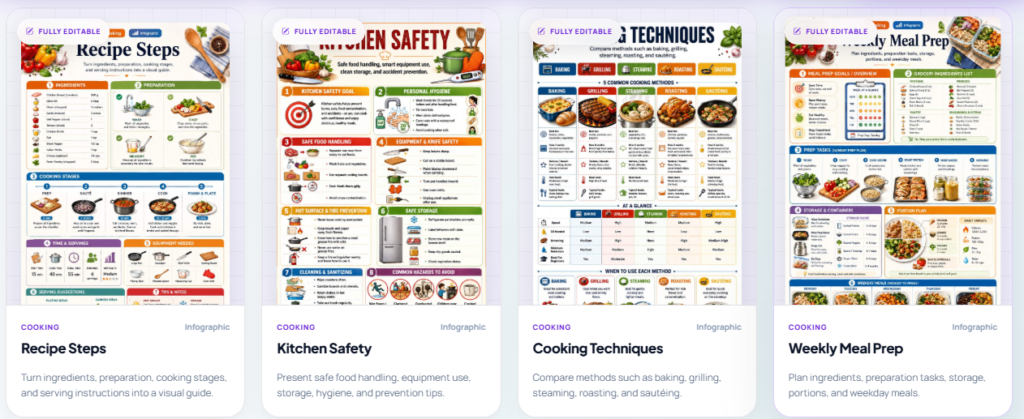
Data and brand workflows make Infographicmakerai especially relevant for businesses. It supports 20+ chart types and connections to sources including Google Sheets, CSV files, APIs and databases. You can also create brand profiles using logos, colors and fonts, then apply those assets across future designs. Real-time collaboration, comments and version control help teams move from draft to approval without continually passing exported files around.
Infographicmakerai Highlighted Features
- AI Content to Visual: Turns prompts, reports, briefs and notes into structured visual drafts, reducing the time you spend planning layouts.
- Section Regeneration: Lets you regenerate individual parts of a visual instead of restarting a successful design.
- Smart Editor: Provides intelligent spacing, alignment and layout assistance while keeping the design editable.
- Charts and Analytics: Supports 20+ chart types and helps transform datasets into easier-to-read visual stories.
- Data Connections: Works with sources including CSV, Google Sheets, APIs and databases for data-focused workflows.
- Brand Kit: Stores logos, colors and fonts so you can create more consistent business visuals.
- Flexible Exporting: Supports PNG, SVG, PDF and JPEG exports, with higher plans adding stronger resolution and format options.

Pros of Infographicmakerai
- You can move from raw content to a structured infographic without designing from scratch.
- Generated designs remain editable instead of becoming fixed AI images.
- Individual sections can be regenerated when one part of the output misses the mark.
- Live data and chart features make it useful for reports as well as marketing graphics.
- Brand Kits reduce repeated work when you produce content for the same company.
- Team collaboration combines comments, editing and version history in one workflow.
- SVG and high-resolution options make finished visuals suitable for more than social media use.
Cons of Infographicmakerai
- The Free plan restricts you to three watermarked exports each month.
- AI-heavy users must watch their monthly credit allowance because subscription credits reset each month.
Cost of Using Infographicmakerai
Free: $0 per month with 50 AI credits and three watermarked exports.
Starter: $19 per month with 500 AI credits, 50 monthly exports, all templates, and one Brand Kit.
Pro: $49 per month with 2,000 AI credits, unlimited exports, premium templates, 4K export, and five Brand Kits.
Business: $99 per month with 5,000 AI credits, unlimited exports, 4K and SVG support, unlimited Brand Kits, five team seats, API access, and dedicated support.
2. Venngage
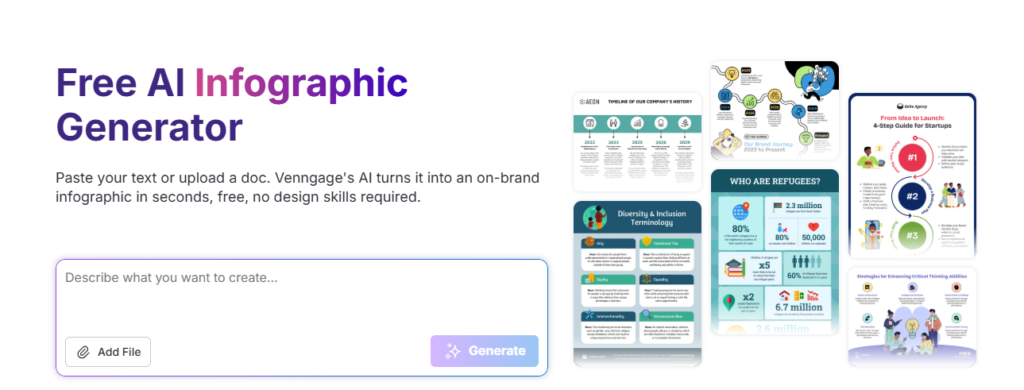
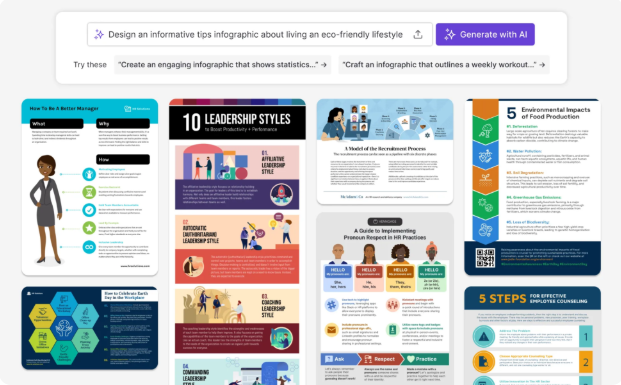
Venngage is a mature infographic platform with strong AI features for business and data-heavy visual communication. Its AI generator accepts prompts and content uploads, then builds a structured infographic that you can continue editing. The trade-off is that useful professional features, stronger exports and team functionality increasingly sit behind paid plans.
Venngage Highlighted Features
- AI Infographic Generator: Converts text or documents into editable infographic drafts.
- Data Visualization: Supports customizable charts, tables, maps and data-focused layouts.
- Brand Kits: Helps businesses apply brand assets consistently.
- AI Visual Tools: Includes AI-generated icons, images and content assistance.
- Large Template Library: Provides thousands of business, report and infographic starting points.
Pros of Venngage
- Strong focus on infographic creation rather than generic graphic design.
- Good selection of data visualization options.
- Large professional template collection.
- Useful branding tools for repeated business content.
- AI generation remains connected to an editable design workflow.
Cons of Venngage
- Many professional capabilities require a paid plan.
- Business pricing becomes more significant when several people need seats.
- Free usage is better for testing than high-volume publishing.
- Its broad editor can feel more involved than simple text-to-visual tools.
Cost of Using Venngage
Free: $0 for basic creation and platform testing.
Premium: $19 per month, or about $10 per month when billed annually.
Business: $49 per user per month, or about $24 per user per month when billed annually.
Enterprise: Starts at $499 per month for larger deployments with a minimum team requirement.
3. Piktochart
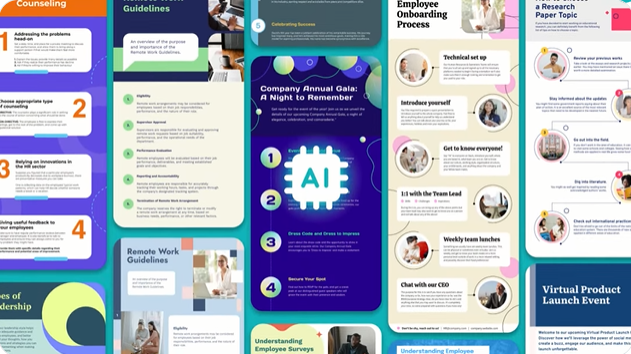
Piktochart is a strong option when you want AI generation without giving up traditional infographic editing. You can start from a prompt, pasted text or uploaded content, then change the resulting copy, colors, icons, fonts, spacing and structure. It is particularly useful for reports, educational material and long-form information, although frequent AI generation can push you beyond the free credit allowance.
Piktochart Highlighted Features
- AI Infographic Generator: Creates editable visuals from prompts and existing content.
- Document Uploads: Supports formats including PDF, DOCX and TXT.
- AI Outline: Helps organize information before or during generation.
- Editable Design Elements: Lets you adjust text, colors, fonts, images and sections.
- AI Design Suite: Also creates reports, banners, posters and other visual formats.
Pros of Piktochart
- Easy to use without professional design experience.
- Strong fit for long, structured infographics.
- Generated outputs remain customizable.
- Free accounts include monthly AI credits.
- Good balance between AI automation and manual design control.
Cons of Piktochart
- Free AI credits may run out quickly during repeated generation.
- Some higher-level business features require upgrading.
- Image generation consumes additional credits.
- Very complex designs can still require manual layout work.
Cost of Using Piktochart
Free: $0 with limited usage and monthly AI credits.
Pro: $15 per month, or $10 per month when billed annually.
Business: $20 per month, or $17 per month when billed annually.
Enterprise: Custom pricing.
4. Visme
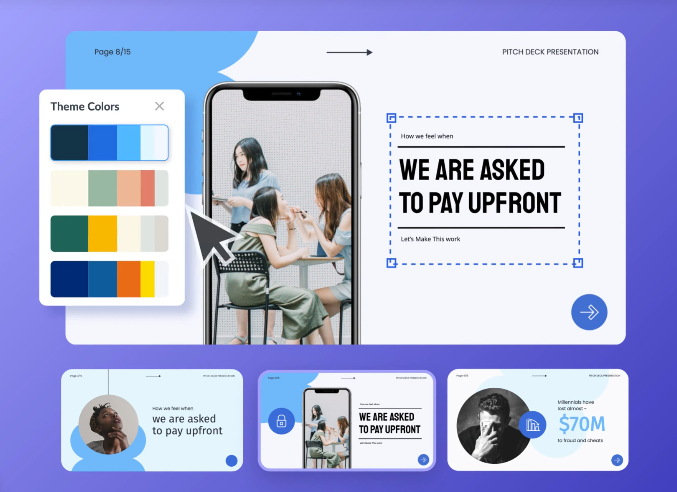
Visme works well when an infographic is only one part of a larger visual-content strategy. Alongside infographics, you can create presentations, reports, forms, charts, social graphics, and interactive content. Its depth is an advantage for businesses, but it also means you get more tools and controls than someone seeking a minimal, one-purpose infographic generator may need.
Visme Highlighted Features
- AI Infographic Generation: Creates editable infographic drafts from prompts.
- Interactive Content: Adds animation, links, hotspots, and other interactive elements.
- Data Visualization: Includes charts, graphs, widgets, and data-focused visual components.
- Brand Controls: Pro users gain Brand Kit and deeper branding options.
- Multiple Export Formats: Paid plans support formats beyond standard images, including PPTX and HTML5.
Pros of Visme
- Excellent for businesses producing several types of visual content.
- Strong interactive and animation capabilities.
- Detailed brand-management options.
- Large selection of templates and visual assets.
- Good data visualization tools.
Cons of Visme
- The number of features creates a larger learning curve than simpler generators.
- Free accounts have limited AI credits and download capabilities.
- Advanced branding is tied to higher plans.
- Team and enterprise requirements increase overall cost.
Cost of Using Visme
Basic: $0 per month.
Starter: $12.25 per person per month when billed annually, or $147 per year.
Pro: $24.75 per person per month when billed annually, or $297 per year.
Enterprise: Custom pricing for organizations with 10 or more users.
5. Infogram

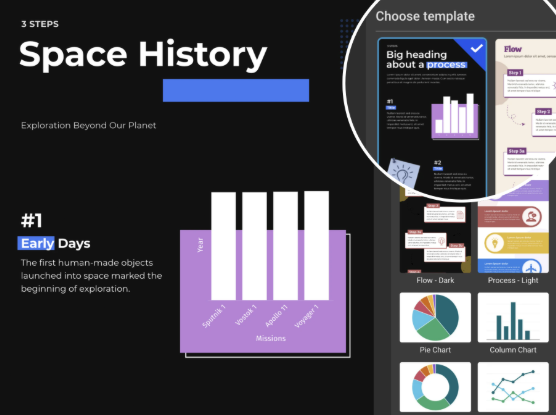
Infogram deserves attention when your infographic starts with data rather than decorative graphics. It combines AI infographic creation with charts, maps, interactive visualizations, data imports, live-data connections, and embeddable content. If your priority is highly creative social artwork, another design-first platform may feel broader, but Infogram’s data capabilities are hard to ignore.
Infogram Highlighted Features
- AI Infographic Maker: Creates visual stories using AI assistance.
- 35+ Interactive Chart Types: Even the Basic plan includes numerous chart options.
- Data Import: Lets you bring existing datasets into visual projects.
- Interactive Publishing: Supports online publishing and embedded visual content.
- Live Data and Connections: Paid plans support connected and changing datasets.
Pros of Infogram
- Excellent for data-driven infographic projects.
- Strong interactive chart capabilities.
- Useful map and visualization options.
- Supports web publishing and embedding.
- Live-data features suit recurring reports and dashboards.
Cons of Infogram
- The Basic plan limits project volume.
- Stronger branding controls require more expensive plans.
- Team collaboration is priced well above entry-level plans.
- It is more data-centric than general creative-design platforms.
Cost of Using Infogram
Basic: Free.
Pro: $19 per month when billed yearly.
Business: $67 per month when billed yearly.
Team: $149 per month when billed yearly.
Enterprise: Custom pricing.
6. Napkin AI
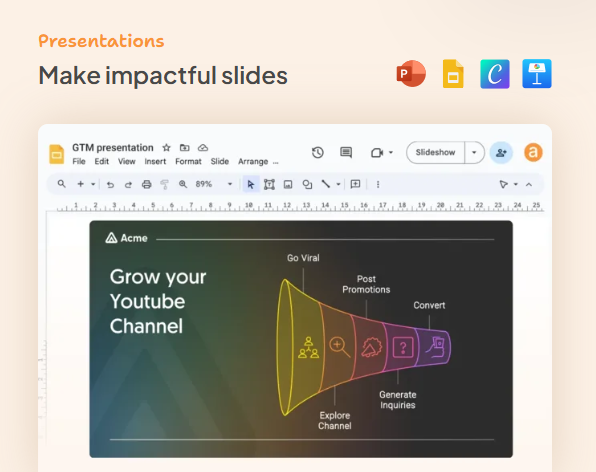
Napkin AI approaches infographic creation differently. Instead of behaving like a traditional template library, it specializes in converting written ideas into diagrams and visual explanations. You can import several document formats, select text and generate matching visuals. That simplicity is useful for presentations, articles and business explanations, but people building dense poster-style infographics may want a more conventional page-design environment.
Napkin AI Highlighted Features
- Text-to-Visual Generation: Turns selected written content into diagrams and visual explanations.
- Multiple File Imports: Supports PPT, DOC, PDF, HTML and Markdown.
- Unlimited Editing: You can continue adjusting generated visuals.
- Flexible Exporting: Free users get PNG and PDF, while paid tiers add PPT and SVG.
- Brand Styles: Paid plans provide stronger brand customization.
Pros of Napkin AI
- Very fast for turning text into explanatory visuals.
- Generous file-import support.
- PNG and PDF exports are available on the free tier.
- SVG export is useful for scalable design workflows.
- Simple workflow suits non-designers.
Cons of Napkin AI
- Free exports carry Napkin branding.
- AI generation uses credits based roughly on selected word volume.
- Traditional template-heavy infographic workflows are not its core focus.
- Custom branding requires a paid plan.
Cost of Using Napkin AI
Free: $0 with 500 AI credits per week.
Plus: $9 per person per month with 10,000 monthly AI credits.
Pro: $22 per person per month with 30,000 monthly AI credits.
Enterprise: Contact the company for pricing.
7. Gamma

Gamma is broader than a dedicated infographic maker. Its AI-first platform creates presentations, documents, websites, social content and graphics, while Smart Diagrams and visual layouts can handle infographic-style communication. This makes Gamma appealing when you regularly repurpose one idea across several formats, but a dedicated vertical-infographic workflow is not its sole focus.
Gamma Highlighted Features
- AI Content Generation: Builds structured visual content from prompts and existing information.
- Smart Diagrams: Converts concepts into structured visual diagrams.
- File Import: Supports PDF and PPTX imports.
- Multiple Exports: Supports PDF, PPTX, PNG and Google Slides.
- Branding and API Options: Higher plans offer custom branding, fonts, analytics and API access.

Pros of Gamma
- Excellent for turning one idea into several content formats.
- Fast AI-first creation workflow.
- Strong presentation and document generation.
- Useful branding features on higher tiers.
- API access supports automated content workflows.
Cons of Gamma
- It isn’t built solely around traditional long-form infographics.
- Free users face generation and formatting limitations.
- API access requires Pro or higher.
- Advanced branding and premium AI models require paid tiers.
Cost of Using Gamma
Free: $0.
Plus: Approximately $8 per month.
Pro: Approximately $18 per month.
Ultra: Approximately $100 per month.
Gamma also offers Team, Business and Enterprise options for organizations. Its 2026 product materials list higher organizational pricing separately from individual plans.
How to Choose the Right AI Infographic Maker
Start by identifying what slows you down today.
If your biggest problem is turning raw information into a polished first draft, prioritize text-to-visual generation and intelligent layout tools. Infographicmakerai, Venngage and Piktochart are particularly relevant here.
If you regularly publish statistics or changing datasets, look closely at data connections, editable charts and export quality. Infographicmakerai and Infogram provide strong data-focused workflows, while Piktochart and Venngage also offer practical visualization tools.
For interactive web content, Visme and Infogram deserve consideration. If your main problem is converting paragraphs into diagrams quickly, Napkin AI is easier to understand than a full creative suite.
Gamma makes more sense when an infographic is one output among presentations, documents and social assets.
Don’t make the final decision from AI generation quality alone. Test what happens after generation. Can you rewrite a section? Change a chart? Move elements? Apply your brand? Export a vector file? Fix one bad section without generating the entire design again?
Those questions separate a useful production tool from an impressive demo.
Must-know Tip: Stephen Few argues that finding signals requires reducing noise. The same idea applies to AI infographics. Remove unnecessary decoration when it competes with the message.
Are AI-Generated Infographics Accurate?
They can be, but AI output should never be treated as automatically verified.
An infographic combines several risk points. The AI may summarize source material incorrectly, invent a statistic, choose an inappropriate chart, change a number while rewriting copy, or imply a relationship the dataset does not support.
The safest workflow is simple.
Check every numerical value against the original source. Confirm dates and labels. Inspect chart axes. Make sure percentages actually total what you expect. Review claims independently before publishing them.
This becomes even more important for healthcare, finance, legal, academic and corporate reporting.
AI should reduce design work. It should not replace fact-checking.
A good infographic generator therefore gives you editing control after generation. If the AI gets one section wrong, you should be able to correct that section without rebuilding the whole visual.
Conclusion
Choosing the Best Infographic Maker AI comes down to what happens between your raw information and your final publishable visual.
If you want a balanced combination of AI content-to-visual generation, editable design, chart creation, data connections, Brand Kits, exports and collaboration, Infographicmakerai deserves the first look. Its ability to regenerate individual sections is particularly useful because AI rarely produces every part of a complex visual perfectly on its first attempt.
Venngage and Piktochart remain capable alternatives for traditional infographic work. Infogram is particularly strong with data, Visme with interactive visual content, Napkin AI with text-to-diagram creation and Gamma with broader AI content production.
Whichever platform you choose, don’t judge it from the first generated image. Test the complete workflow: input, generation, editing, fact-checking, branding and export. The tool that removes the most friction from those steps is the one that will provide the most value.
Frequently Asked Questions
What is an AI infographic maker?
An AI infographic maker uses artificial intelligence to transform prompts, documents or datasets into structured visual content. It can automate tasks such as layout creation, summarization, chart selection, visual hierarchy and design suggestions.
What is the best infographic maker AI?
The right choice depends on your workflow. Infographicmakerai is a strong all-round option for AI content-to-visual generation, editable layouts, data visualization, branding and team workflows. Other platforms may suit specialized requirements such as interactive charts or text-to-diagram generation.
Can AI create an infographic from a PDF?
Yes. Several tools support document imports. Piktochart supports PDF uploads, Napkin AI supports PDF and other document types, while some other platforms can extract or restructure content from uploaded documents.
Can I turn CSV data into an infographic?
Yes. Data-focused platforms can import CSV information and use it to create charts or other visualizations. Always check the generated labels and calculations before publishing.
Are AI-generated infographics editable?
Many leading platforms create editable designs. You can typically modify text, colors, fonts, charts, icons, spacing and layouts after generation. Editing depth varies significantly between tools.
Can I use AI infographic makers without design experience?
Yes. Reducing manual design work is one of their primary advantages. AI can establish the initial structure while templates, alignment tools and automatic layout suggestions help you refine the result.
Are there free AI infographic makers?
Yes. Several tools in this comparison provide free accounts or limited free usage. Restrictions commonly involve AI credits, exports, watermarks, storage, templates or premium branding features.
What should I include in an infographic prompt?
Specify your subject, audience, goal, major facts, sections, preferred visual type, tone and final use. The more relevant context you provide, the less guessing the AI has to do.
Can AI infographic tools create accurate charts?
They can create useful charts, but you should verify the data, scale, labels and chart type yourself. A visually attractive graph can still communicate the wrong conclusion if the underlying setup is incorrect.
Are AI infographic generators safe for confidential information?
It depends on the platform, plan and privacy policy. Check how uploaded information is processed, stored and used before submitting confidential company, customer or research data. For sensitive projects, security controls should be part of your buying decision.

Comments
0 responsesNo comments yet. Be the first to share your thoughts.