 An Adobe Express alternative can give you more control over infographics, AI-generated visuals, data storytelling, collaboration, or your monthly design budget. The market is moving quickly, too. HubSpot’s 2026 State of Marketing research, based on more than...
 A Venngage alternative may give you a faster, cheaper, or more specialized way to turn information into visual content. The choice matters more than ever. In 2025, U.S. businesses invested about $143 billion annually in the visual content economy, while 89% of...
 Figma has become one of the most recognizable names in digital design. Product designers use it to create interfaces, developers inspect layouts and components, marketers build campaign visuals, and product managers collaborate on early concepts. Its browser-based...
 Have you ever created a design in Canva and felt that you needed more advanced features, better AI assistance, or a tool built specifically for your workflow? A Canva alternative can help you create professional graphics, presentations, infographics, and marketing...
 The Best Infographic Maker AI can turn a rough idea, report, dataset, or document into a visual story without forcing you to design every element manually. That matters more than ever. In HubSpot’s 2026 marketing research, 80% of marketers said they use AI for...
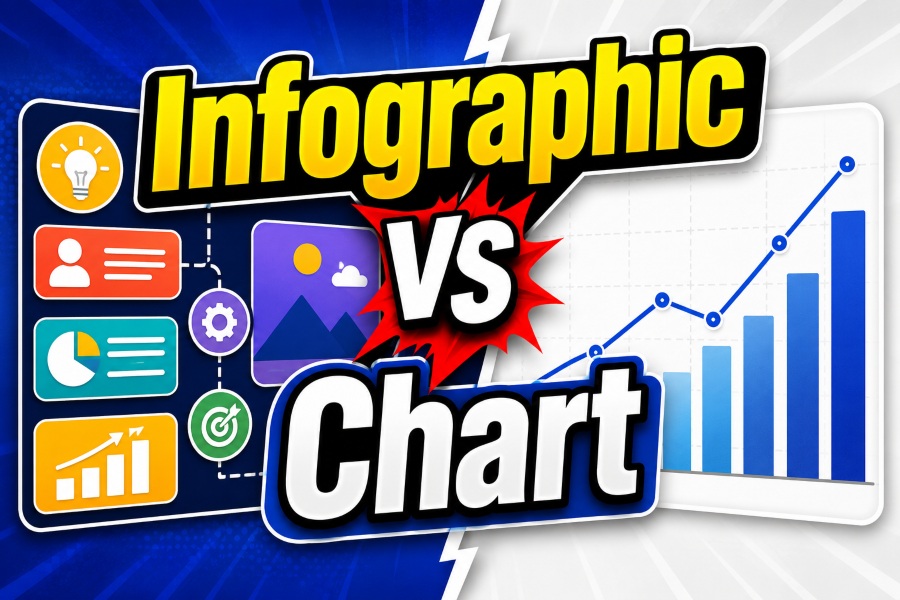 Infographic vs chart is a common comparison when people decide how to present information visually. Both formats help readers understand complex ideas, but they solve different communication problems. A chart focuses mainly on displaying data relationships, patterns,...