

Click any AI tool above to instantly get a summary of this article. Perfect for quick insights when you're short on time.
A Venngage alternative may give you a faster, cheaper, or more specialized way to turn information into visual content. The choice matters more than ever. In 2025, U.S. businesses invested about $143 billion annually in the visual content economy, while 89% of business leaders described visual fluency as a must-have skill. Another 84% said poor visual communication causes delays and confusion.
Venngage remains a capable infographic platform, but different workflows demand different tools. You may need AI-first creation, interactive graphics, live data, stronger free exports, simpler brand management, or lower pricing. This guide compares 10 options by real features, limitations, pricing, and practical use cases.
How to Create an Infographic With AI From a Text Prompt
An Illustrative Case Study: From Report to Infographic
Mr. Daniel manages marketing for a financial-services company and receives a six-page quarterly report filled with percentages, customer trends, and product data. Instead of rebuilding every chart manually, he pastes the main findings into an AI infographic generator and asks it to create a visual summary. He then reviews the numbers, changes the hierarchy, applies company colors, and exports the finished graphic.
That workflow reflects a wider change in marketing. In 2025, 85% of surveyed marketers reported using generative AI, although only 15% had fully integrated it into daily workflows. AI can therefore shorten the first-draft stage, but you still need to verify every statistic, label, chart, and claim before publishing.
Why Users Look Beyond Venngage
Venngage’s free plan currently limits you to five designs and public sharing. Downloads require a paid plan, while features like Brand Kits, broader team controls, PDF or PowerPoint export, and deeper collaboration sit on higher tiers.
Venngage also doesn’t offer a standard free trial for paid subscriptions, though free users can test AI credits. If you create visuals frequently, these limits can make switching worthwhile when another platform offers the specific export, AI, collaboration, or data workflow you need.
Must-know Tip: Treat an AI-generated infographic as a structured first draft, not verified research. Check every number against your original source before the visual reaches a customer, client, classroom, or public website.
How to Choose the Right Venngage Alternative for Your Workflow
Match the Tool to Your Main Output
Start with what you create most often. A marketer producing social graphics needs different capabilities from an analyst building live dashboards or a teacher creating interactive learning materials. Avoid paying for sophisticated animation, analytics, or team controls when your main requirement is a clean static infographic.
This matters because 57% of B2B content marketers reported using data visualizations or other visual content in 2025. Interactive content reached 27%, showing that static design remains important while interactive experiences serve a smaller but meaningful group.
Check the AI and Data Workflow
Look beyond an AI button on the homepage. Test whether the platform can turn your actual text or data into a usable layout, whether you can edit every generated element, and whether charts preserve the figures you supplied.
AI adoption is growing quickly. In 2025, 93% of surveyed marketing teams had dedicated generative-AI budgets for 2025/26, while 77% were already using large language models. That makes AI capability worth comparing, but accuracy and editability matter more than the number of AI features listed.
Compare Export, Branding, Collaboration, and Cost
Check the formats you need before subscribing. PNG may be enough for a blog, while reports can require PDF, presentations can require PPTX, and interactive work may need web publishing or HTML-based output.
You should also calculate your real team cost. A $10 individual plan can become expensive when every collaborator needs a paid seat, while another product may bundle several team members. Review storage, Brand Kits, private sharing, watermarks, AI credits, and download limits together rather than judging software by its advertised starting price.
Must-know Tip: Switch when the new platform removes a recurring bottleneck. A cheaper subscription is not a saving if your team spends more time rebuilding charts, correcting AI output, or manually applying brand styles.
10 Top-Rated Venngage Alternative Tools
Images were among the most frequently used marketing formats in 2025, with 29% of marketers naming them among their most-used formats.
Nineteen percent also identified images among the formats generating the highest ROI, while 15% planned to increase investment in image content. That demand explains why infographic software now ranges from simple template editors to AI-driven visual communication platforms.
The following 10 Venngage alternative tools cover different needs. Some specialize in turning text into visual stories, while others concentrate on data, interactive content, photo editing, presentations, branding, or general graphic design.
1. Infographicmakerai
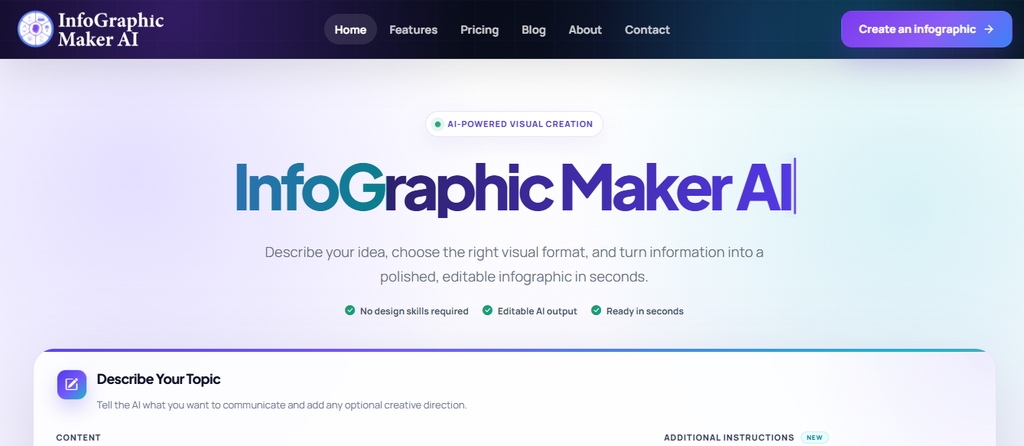
Infographicmakerai takes an AI-first approach to infographic creation. You can paste notes, a report, data, a brief, or a prompt and use AI to structure the information into a visual rather than manually building the entire layout from an empty canvas.
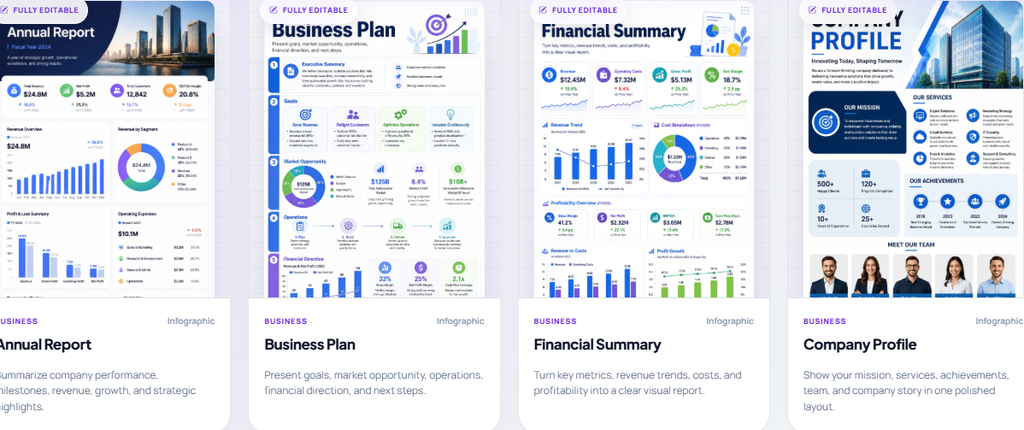
Its value becomes clearer when you need repeated visual content. AI Content to Visual creates an initial structure, while the Smart Editor helps with layout suggestions, alignment, spacing, and editing, so you can move from raw information to a refined asset without treating AI output as untouchable.
The platform also extends beyond basic infographic generation. Depending on your plan, you can work with data visualizations, Brand Kits, higher-resolution exports, analytics, team collaboration, SVG output, and API access.
That combination makes it especially relevant if your bottleneck is the blank-canvas stage. Instead of spending the first part of a project deciding how every section should be arranged, you can generate a starting structure and spend more time improving the message, numbers, and visual hierarchy.

Infographicmakerai Highlighted Features
- AI Content to Visual: Converts text, notes, reports, briefs, or prompts into structured visual content, reducing the time needed to build an initial infographic.
- Smart Editor: Provides layout suggestions, auto-alignment, spacing guidance, and real-time previews so you can refine generated designs without starting over.
- AI data visualization: Creates charts, graphs, and visual representations from supplied information, helping you make numerical content easier to understand.
- Section regeneration: Lets you regenerate parts of a design rather than rebuilding the entire infographic when one section needs improvement.
- Brand Kits: Paid tiers let you save brand assets so repeated visual content stays more consistent in colors, fonts, and identity.
- Flexible exports: Depending on your plan, available formats include PNG, JPG, PDF, SVG, and higher-resolution output for different publishing requirements.
Infographicmakerai Pros
- You can generate an infographic directly from text or data instead of manually planning every block.
- Generated designs remain editable, giving you control after the AI produces the first version.
- The Free plan includes 50 AI credits each month.
- Starter includes 500 monthly AI credits, while Pro raises the allowance to 2,000.
- Pro supports unlimited exports and 4K output.
- Business adds API access, broader collaboration, and SVG export for more demanding workflows.
- Brand Kit options help reduce repetitive styling when you produce visuals regularly.
Infographicmakerai Cons
- The Free plan allows only three exports per month and places a watermark on those exports.
- AI credits reset monthly, so heavy AI users need to choose a plan that matches their generation volume.
Infographicmakerai Pricing Plans
Free: $0/month with 50 AI credits and three watermarked exports each month.
Starter: $19/month with 500 AI credits, 50 monthly exports, all templates, 1080p output, and one Brand Kit.
Pro: $49/month with 2,000 AI credits, unlimited exports, 4K output, five Brand Kits, and advanced analytics.
Business: $99/month with 5,000 AI credits, unlimited exports, 4K and SVG output, team features, API access, and dedicated support.
2. Piktochart
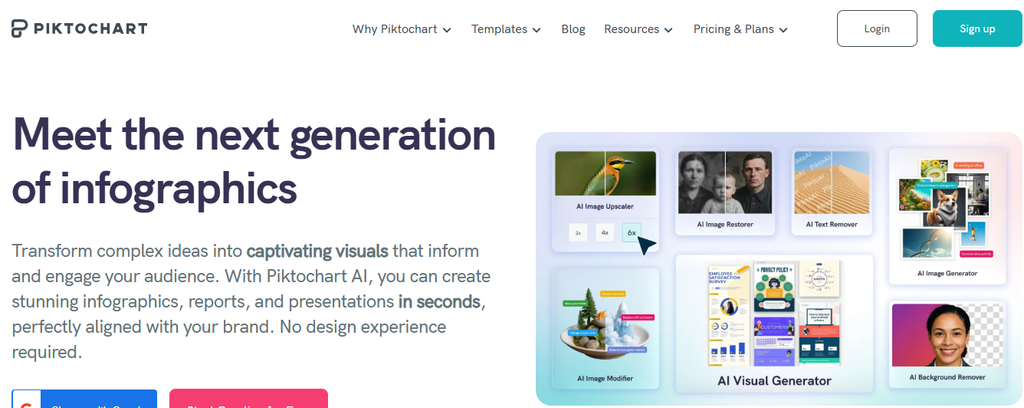
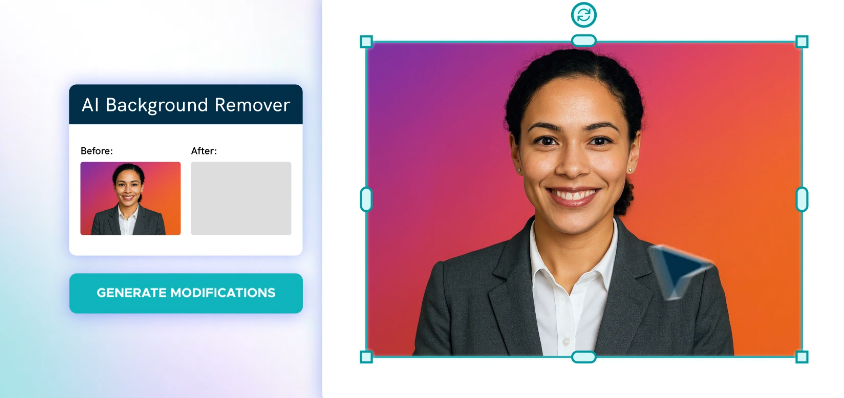
Piktochart is a mature visual communication platform built around infographics, reports, presentations, posters, and related business visuals. Its AI generators can accelerate initial creation, while native chart and data features make it useful when your graphics contain more than decorative text and icons.
A concern is its export structure. The Free plan currently provides only two PNG downloads, while PDF and PowerPoint downloads require the Business tier, so frequent professional exporting can push you toward a paid subscription.
Piktochart Highlighted Features
- AI visual generation: Creates infographics, reports, presentations, and other visual drafts from prompts.
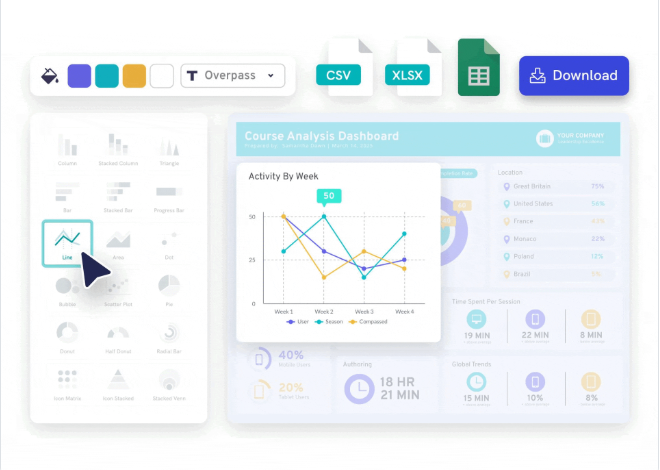
- Data connectivity: Supports CSV data and Google Sheets-based workflows for data-driven visuals.
- Premium asset library: Pro provides access to more than 5 million premium icons, illustrations, and 3D graphics.
- Brand Kit: Business users can manage colors, fonts, logos, and branded templates.
- Team collaboration: Supports commenting, editing, shared assets, and multi-member workspaces.
Piktochart Pros
- More than 14 million users have used the platform worldwide.
- The Free plan supports unlimited visual projects.
- Pro provides 500 AI credits.
- Business increases the allowance to 1,000 AI credits.
- Education and nonprofit discounts are available.
Piktochart Cons
- Free users receive only two PNG downloads.
- PDF and PowerPoint export require Business.
- Pro pricing is charged per member.
- Some advanced branding controls require Business.
Piktochart Pricing Plans
Free: $0. Pro: $15/member/month, or $10/member/month billed annually. Business: $20/member/month, or $ 17/member/month billed annually. Education: $39.99/member/year. Nonprofit: $60/member/year. Enterprise and Campus plans use custom pricing.
3. Visme
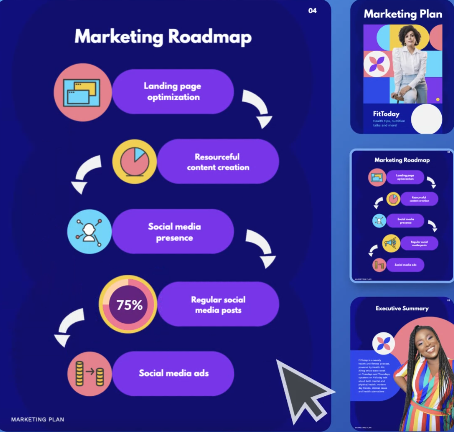
Visme combines infographics with presentations, reports, documents, interactive content, forms, videos, and broader business design. For data-heavy work, it offers more than 50 chart, graph, widget, and map options, plus spreadsheet imports and interactive publishing.
The trade-off is complexity. If you only need a simple infographic twice a month, the extra interactive, analytics, workflow, and content-management features may be more software than you need.
Visme Highlighted Features
- 50+ data visualization options: Helps you turn figures into charts, maps, graphs, and widgets.
- Spreadsheet imports: Supports data from Google Sheets and Excel.
- Interactive content: Adds links, hover effects, pop-ups, and animation.
- Brand Kit: Stores logos, fonts, colors, and brand guidelines.
- Analytics: Tracks engagement with shared visual content.
Visme Pros
- Strong mix of static and interactive design.
- Live or imported data improves reporting workflows.
- Brand controls suit teams producing frequent content.
- Multiple publishing and export methods are available.
- Built-in analytics add value to shareable content.
Visme Cons
- The broader interface can feel excessive for simple designs.
- Key export capabilities require paid plans.
- Pro costs more than several entry-level alternatives.
- Advanced interactive features can involve a learning curve.
Visme Pricing Plans
Basic: $0. Starter: $12.25/person/month billed annually, or $147/year. Pro: $24.75/person/month billed annually, or $297/year. Enterprise uses custom pricing.
4. Infogram
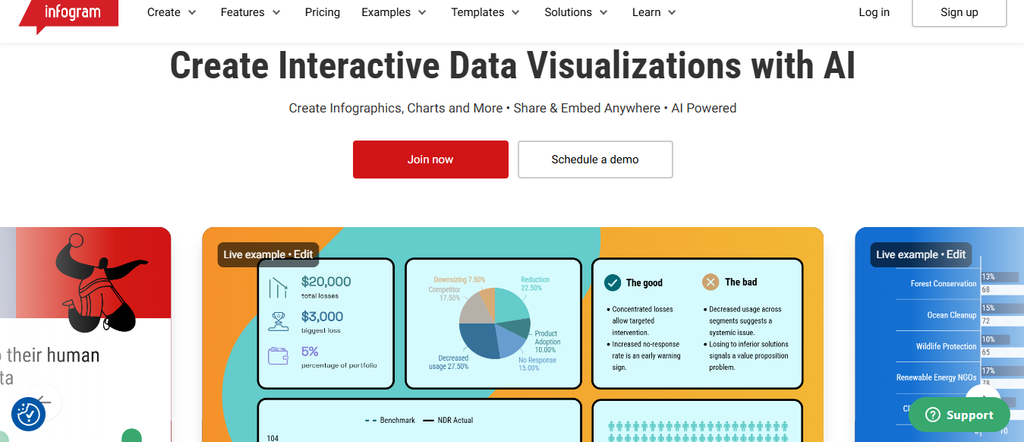
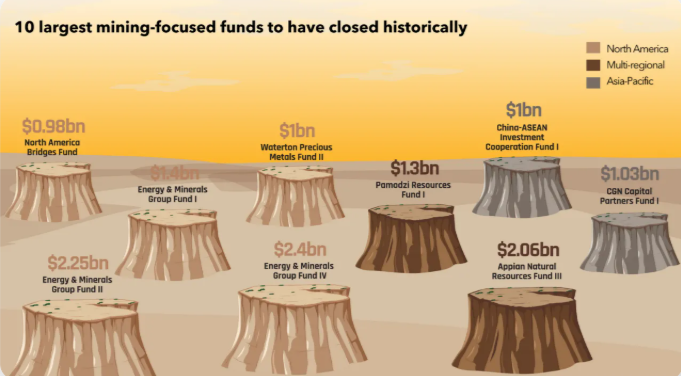
Infogram is one of the strongest choices here when your priority is data visualization rather than general graphic design. Its Basic plan includes more than 35 interactive chart types and 13 map types, while paid plans expand maps, live data, privacy controls, analytics, and collaboration.
The limitation is cost at the higher tiers. A team that mainly makes static marketing infographics may struggle to justify Business or Team pricing when lower-cost tools can handle simpler design work.

Infogram Highlighted Features
- Interactive charts: Supports 35+ chart types even on the Basic plan.
- Maps: Pro expands access to more than 800 map types.
- Live data: Paid plans can connect to changing data sources.
- Interactivity: Supports animations, tooltips, links, and embedded visuals.
- Collaboration: Team includes real-time collaboration and commenting.
Infogram Pros
- Excellent fit for data-heavy storytelling.
- Basic includes data import.
- Pro supports up to 100 projects.
- Business supports up to 1,000 projects.
- Interactive embedding works well for digital publishing.
Infogram Cons
- Basic limits you to 10 projects.
- Private controls are not part of the Free tier.
- Business becomes expensive for solo users.
- Team pricing is high for small organizations.
Infogram Pricing Plans
Basic: Free. Pro: $19/month billed annually. Business: $67/month billed annually. Team: $149/month billed annually. Enterprise: custom pricing.
5. Adobe Express

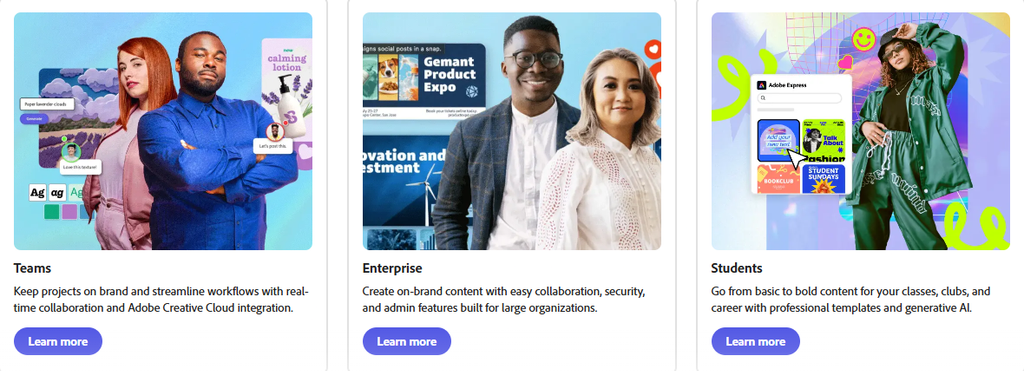
Adobe Express is a practical choice when you want infographics alongside social posts, videos, images, flyers, and other everyday marketing assets. Its infographic editor includes templates, stock content, Adobe Fonts, branding controls, generative AI, object editing, and cross-device creation.
Its biggest drawback is specialization. Adobe Express can make attractive infographics, but advanced data visualization is not its central strength, so analysts dealing with changing datasets may prefer Infogram, Piktochart, or Visme.
Adobe Express Highlighted Features
- Generative AI: Creates images, templates, text effects, and object edits from prompts.
- Infographic templates: Provides professionally designed starting layouts.
- Adobe Fonts: Gives you access to a large font ecosystem.
- Brand controls: Supports logos, colors, and repeatable branded styles.
- Co-editing: Lets collaborators edit projects and provide feedback.
Adobe Express Pros
- Free plan is genuinely usable for basic design.
- Strong integration with Adobe’s creative ecosystem.
- Works across desktop and mobile devices.
- Handles far more formats than infographics alone.
- Premium remains affordable for an individual creator.
Adobe Express Cons
- Data visualization is less advanced than dedicated infographic platforms.
- Many premium assets require an upgrade.
- Generative AI usage is credit-based.
- Teams require at least two seats on the team offer.
Adobe Express Pricing Plans
Free: $0. Premium: $9.99/month. Adobe Firefly Pro: $19.99/month and includes Express Premium. Teams: promotional $4.99/license/month for the first year, then $7.99/license/month, with a two-seat minimum. Enterprise: custom pricing.
6. DocHipo

DocHipo targets business users who need infographics plus presentations, proposals, posters, brochures, social graphics, and many other document types. Its current platform includes charts, maps, premium design assets, AI writing, AI translation, AI image generation, background removal, and integrations.
The main Free-plan restriction is scale. You can keep only five documents, which makes it better for testing the editor than for an ongoing production workflow.
DocHipo Highlighted Features
- Drag-and-drop editor: Simplifies document creation for non-designers.
- AI tools: Includes AI writing, translation, image generation, and background removal.
- Charts and maps: Adds visual data components to business content.
- Smart Resize: Adapts existing designs to new dimensions.
- Integrations: Connects with stock libraries and tools such as Mailchimp and Typeform.
DocHipo Pros
- Covers many business document categories.
- Free plan provides access to core design tools.
- Pro removes the five-document ceiling.
- High-resolution downloads are available on Pro.
- Pro Unlimited can suit large teams.
DocHipo Cons
- Free accounts are capped at five documents.
- Premium templates require Pro.
- Advanced assets require a paid plan.
- Unlimited-user pricing is unnecessary for small teams.
DocHipo Pricing Plans
Free: $0.
Pro: $12/user/month.
Pro Unlimited: $288/month for unlimited users. Taxes may apply.
7. Genially
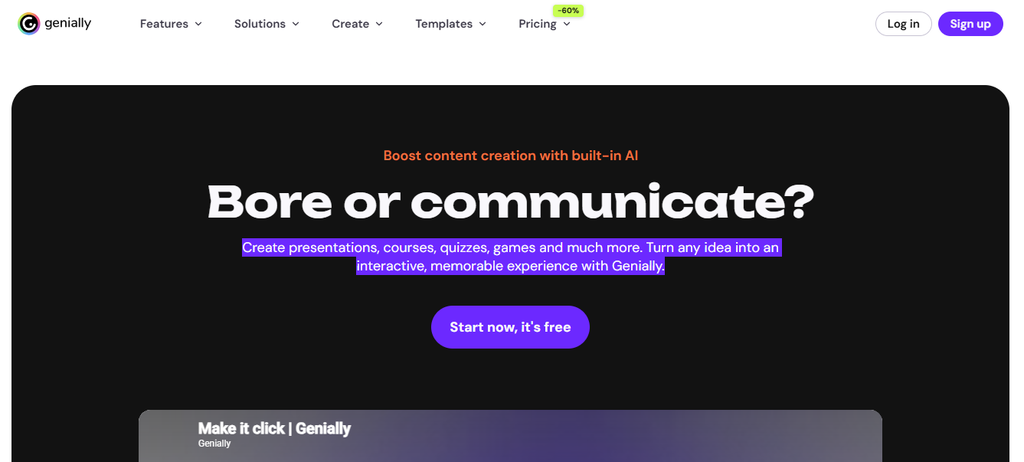
Genially approaches infographics differently by focusing heavily on interaction. You can add pop-up windows, hover labels, video, audio, quizzes, surveys, animations, clickable objects, and other elements that turn a static graphic into an explorable experience.
That strength is also its main limitation. If you primarily need printable PNG or PDF infographics, much of Genially’s interactive toolkit becomes unnecessary, and several download, privacy, analytics, and Brand Kit capabilities require paid plans.

Genially Highlighted Features
- Interactive hotspots: Reveal extra information when users interact with the design.
- Animations: Supports timed and click-triggered animation.
- Multimedia: Embeds audio, video, voiceover, and online content.
- Quizzes and surveys: Adds audience participation to visual content.
- Activity analytics: Measures visits, interactions, and responses on supported plans.
Genially Pros
- Strong choice for interactive infographics.
- No coding is needed for animations and interactivity.
- Free users receive 500 AI credits per year.
- More than 1,000 free templates and resources are available.
- Particularly useful in training and education.
Genially Cons
- Many export formats require a paid plan.
- Brand Kit access sits above the entry tier.
- Analytics require higher plans.
- Static-only users may not benefit from its core strengths.
Genially Pricing Plans
Free: $0. Genially also offers Pro, Master, Author, team, and Enterprise options. Its current official pricing page did not expose verified U.S.-dollar figures consistently at the time of review, so dollar amounts are intentionally not quoted rather than converted or guessed.
8. VistaCreate

VistaCreate works best when your infographic needs sit alongside social media, eCommerce, advertising, and everyday marketing design. Its Free Starter plan provides more than 100,000 templates and over 1 million royalty-free photos, videos, and vectors.
Its infographic and data-storytelling depth is lighter than specialized platforms. You get excellent visual-design resources, but analysts who require sophisticated live charts or interactive dashboards should look elsewhere.

VistaCreate Highlighted Features
- Large template library: Starter includes 100,000+ templates.
- Creative assets: Free users receive access to more than 1 million assets.
- AI tools: Pro includes AI image generation, AI Writer, and object removal.
- Brand Kits: Pro supports unlimited Brand Kits.
- Resize tools: Converts designs into other formats quickly.
VistaCreate Pros
- Strong Free plan for general design.
- Pro includes more than 200,000 templates.
- Pro provides access to over 170 million creative assets.
- Up to 10 team members can collaborate on Pro.
- Social scheduling is built into the platform.
VistaCreate Cons
- Less specialized for advanced infographic data.
- AI image generation is capped at 100 generations per month on Pro.
- Several productivity tools require Pro.
- Interactive data storytelling is limited compared with Infogram or Genially.
VistaCreate Pricing Plans
Starter: $0. Pro: $10/month with a 14-day free trial and support for up to 10 team seats.
9. DesignCap
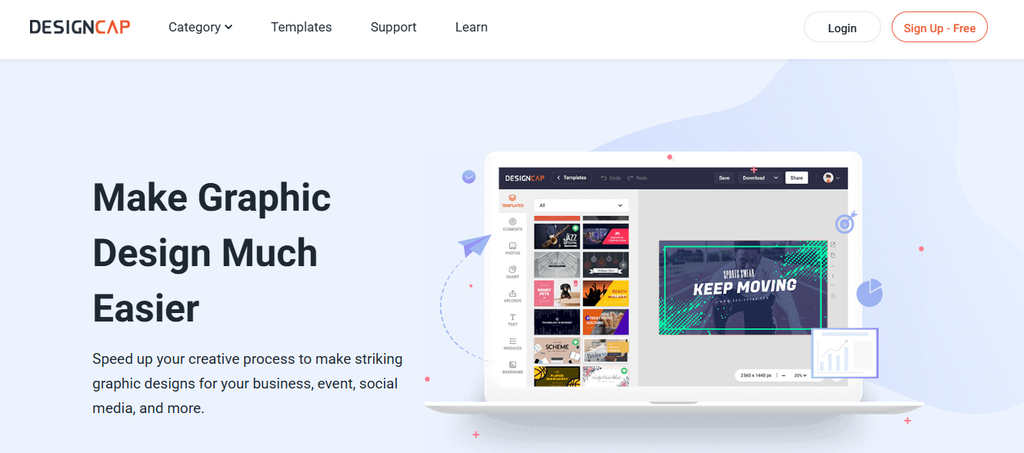
DesignCap keeps infographic creation relatively simple. It combines customizable templates with stock assets, modules, charts, icons, text tools, and high-resolution exports on paid plans.
Its Free plan is heavily restricted. You can upload only five images, save five designs, and export only in JPG, making the free tier more useful for evaluation than sustained professional work.
DesignCap Highlighted Features
- Infographic templates: Provides editable designs for different visual topics.
- Charts: Supports common data displays such as bars, lines, and pies.
- Modules: Reusable content structures speed up layout creation.
- Stock assets: Paid plans unlock broader template and media libraries.
- High-resolution export: Basic and Plus support PNG and PDF.
DesignCap Pros
- Straightforward editor for beginners.
- Annual Basic costs under $5 per month.
- Paid plans unlock unlimited templates.
- Plus supports 1,000 image uploads.
- Plus can save up to 1,000 designs.
DesignCap Cons
- Free exports are JPG only.
- Free accounts can save just five designs.
- Basic allows only 100 uploaded images.
- Its AI capabilities are lighter than AI-first alternatives.
DesignCap Pricing Plans
Free: $0. Basic: $8.99/month or $4.99/month billed annually, totaling $59.88/year. Plus: $12.99/month or $5.99/month billed annually, totaling $71.88/year.
10. Fotor

Fotor began with photo editing but now combines graphic design and a growing range of generative AI tools. Its AI infographic generator can take a text prompt, uploaded data image, or screenshot and create charts, layouts, processes, comparisons, or other infographic-style visuals.
The main concern is that Fotor remains broader than infographic creation. If your job revolves around live datasets, complex chart control, or collaborative reports, a dedicated data-visualization platform offers a more focused workflow.

Fotor Highlighted Features
- AI infographic generator: Produces infographics from text prompts or uploaded visual data.
- Multiple infographic formats: Supports bar charts, pie charts, processes, comparisons, and timelines.
- AI editing: Adds background removal, object removal, enhancement, and other tools.
- Template library: Pro provides access to more than 100,000 templates and assets.
- Photo editing: Combines visual design with a large image-editing toolkit.
Fotor Pros
- Useful when you need both design and photo editing.
- AI can turn prompts into infographic concepts.
- Pro includes more than 100 editing tools.
- Paid plans provide watermark-free HD output.
- Pro+ adds Brand Kits and AI Slides.
Fotor Cons
- Advanced infographic data controls are limited compared with dedicated tools.
- Free exports carry a watermark.
- AI functionality depends on credits.
- Collaboration is not its main strength.
Fotor Pricing Plans
Fotor Basic: $0. Fotor Pro is currently listed at $8.99/month, while Fotor Pro+ is listed at $19.99/month. Prices and AI-credit allocations can vary by billing cycle and promotion.
Best Free Venngage Alternatives With the Fewest Restrictions
Choose Free Software Based on What You Must Export
A free plan is useful only when it lets you finish the job. Venngage currently limits Free accounts to five designs and public sharing, while a tool such as VistaCreate gives you more than 100,000 templates and over 1 million free creative assets.
Piktochart takes another approach. You can build unlimited visual projects, but you receive only two PNG downloads on Free. Infographicmakerai provides 50 AI credits monthly but limits Free accounts to three watermarked exports.
The lesson is simple. Count completed outputs, not advertised templates. If you make 20 visuals every month, a free plan with thousands of templates but two downloads will not support your workflow.
Decide Whether You Need AI, Data, or General Design
Free tools increasingly differ by specialization. Infogram gives you more than 35 interactive chart types and data import on Basic, while Genially supplies interactive elements and 500 AI credits per year.
Adobe Express is broader. It combines thousands of templates with photo editing, animation, generative AI, and 2 GB of storage, making it useful when your infographic is only one part of a larger content calendar.
This distinction matters because creative assets improve communication, not simply appearance. A 2025 visual communication study reported 74% faster memory recall with creative assets compared with dull material. Choose the free tool that helps you explain information more clearly, not the one with the longest feature list.
Know When Paying Saves More Than Staying Free
Free software is ideal for occasional projects, testing, school assignments, and small campaigns. The moment you repeatedly hit download limits, watermarks, public-sharing requirements, storage ceilings, or missing Brand Kits, the free plan begins costing you time instead of saving money.
Compare the first paid tier against your monthly output. DesignCap Basic drops to $4.99 per month with annual billing, Adobe Express Premium is $9.99 monthly, Piktochart Pro starts at $10 per member per month annually, and VistaCreate Pro is $10 monthly.
Must-know Tip: The best free tool is the one whose restrictions do not interrupt your normal workflow. Upgrade because you need a specific capability, not because a pricing page labels a plan “popular.”
Conclusion
Choosing a Venngage alternative comes down to the type of visual work you actually produce. Some platforms are stronger for live data and interactive charts, while others focus on AI generation, everyday graphic design, animation, collaboration, or photo-based content.
Compare the entire workflow before jcommitting: input, editing, data handling, branding, team access, exports, AI limits, and final cost. Tools that can turn raw text into structured visuals, provide editable layouts, visualize data, and maintain Brand Kits can reduce repetitive work when those capabilities match your needs.
The right choice is not automatically the platform with the most features. It is the one that helps you move from information to a clear, accurate, usable visual with the least unnecessary friction.
Frequently Asked Questions
What is the best Venngage alternative?
The best option depends on your workflow. Infographicmakerai focuses on AI-driven visual creation, while Infogram emphasizes data visualization, Genially emphasizes interactivity, and Adobe Express covers broader creative work.
Is there a free alternative to Venngage?
Yes. Infographicmakerai, Piktochart, Visme, Infogram, Adobe Express, DocHipo, Genially, VistaCreate, DesignCap, and Fotor all provide a free entry option or free functionality, although their limits differ.
Which Venngage alternative is best for AI infographics?
Look for software that generates a structured infographic rather than only generating images. Infographicmakerai, Piktochart, Adobe Express, and Fotor all provide AI-assisted visual workflows, but their outputs and editing controls differ.
Which tool is best for data visualization?
Infogram is particularly strong for interactive charts, maps, live data, and dashboards. Visme and Piktochart also provide useful data visualization and spreadsheet workflows.
Which Venngage alternative is best for interactive infographics?
Genially is one of the strongest options for interactive visuals because it supports hotspots, pop-ups, quizzes, multimedia, animations, and audience interactions without coding.
Can I make an infographic from a text prompt?
Yes. Several modern platforms can turn text prompts into visual drafts. You should still verify every statistic and edit the generated layout before publishing.
Which alternative has the best free plan?
That depends on what you need. VistaCreate is generous with templates and assets, Infogram is useful for free data visualization, while AI-first tools may provide limited free generations or exports.
Can I create infographics without design experience?
Yes. Most tools in this comparison use templates, drag-and-drop editors, AI generation, or layout guidance to reduce the amount of design experience required.
What should I check before paying for an infographic maker?
Check export formats, watermarks, AI-credit limits, storage, Brand Kits, team seats, collaboration, private sharing, data imports, and whether the advertised price requires annual billing.
Are AI-generated infographics accurate?
Not automatically. AI can organize content and create visual layouts, but you must verify numbers, labels, sources, calculations, dates, and conclusions yourself.
Is Venngage still good for infographics?
Yes. Venngage remains a capable infographic and visual communication platform with templates, AI tools, accessibility features, data visualization, branding, and collaboration. Alternatives become attractive when another product matches your specific workflow, budget, or output requirements better.

Comments
0 responsesNo comments yet. Be the first to share your thoughts.