

Click any AI tool above to instantly get a summary of this article. Perfect for quick insights when you're short on time.
What is data visualization, and why can one clear chart reveal what pages of figures hide? It is the process of turning information into visual forms that help you recognize patterns, compare results, and ask better questions. In Salesforce’s 2025 State of Data and Analytics research, data leaders estimated that their organizations’ data volumes grow 25% each year.
More information does not automatically mean better judgment. When a spreadsheet mixes hundreds of dates, products, and costs, you can miss the change that actually matters. This guide explains how visualization works, which charts to choose, where the tools fit, and how to avoid conclusions your data cannot support.
What Is Data Visualization and How Does It Work?
Data visualization represents information through charts, graphs, maps, and other displays. Instead of reading a sales report row by row, use a line chart to track revenue or bars to compare stores. The aim is to make numerical relationships understandable without changing their meaning.
Start with a question, not a template. To assess complaints after a product update, compare complaint rates over time using consistent definitions. To compare stores, use the same measure and account for size differences.
Presentation graphics serve different needs from dashboards. A professional infographics maker helps arrange selected facts into an editable visual for presentations or lessons. Check its numbers and labels before publishing.
From Raw Data to Visual Meaning
Imagine a table of website visits, purchases, and advertising costs. The figures may be correct, but rising costs can still be hard to spot. Separate, aligned charts can reveal that pattern without mixing units or scales.
Domo’s Data Never Sleeps 12.0 figures, highlighted in 2025, estimated 251.1 million emails sent worldwide every minute. That striking figure illustrates volume, not growth. You need comparable measurements from other periods to establish a trend.
Must-know Tip: Statistician Edward Tufte advised: “Above all else, show the data.” Make evidence prominent instead of adding pointless decoration. A plain, accurate chart often beats an elaborate graphic.
Why Is Data Visualization Important for Better Decisions?
The importance of data visualization is showing what deserves attention. Shop owners can compare returns, teachers can examine attendance, and public health teams can monitor changes across counties. A focused graphic helps people discuss evidence instead of guessing.
Salesforce’s 2025 research found 63% of surveyed business leaders called their organizations very data-driven. That label does not guarantee better decisions. Gartner reported in 2025 that 30% of chief data and analytics officers considered measuring business impact their leading challenge.
Gartner also found that only 22% of surveyed organizations tracked and communicated impact measures for most analytics activities. Connect each dashboard to an outcome, such as fewer stockouts or shorter response times. Attractive graphics offer little value without a clear decision to support.
Benefits and Limits You Should Understand
Charts help compare performance, find unusual values, and explain findings to newcomers. They cannot fix missing records, biased samples, shifting definitions, or incorrect calculations. Truncated axes and maps based on raw counts can exaggerate differences or conceal context.
The World Economic Forum’s 2025 Future of Jobs report found roughly seven in ten employers considered analytical thinking essential. That demand extends beyond specialist data teams. Visual literacy means recognizing both what a chart demonstrates and what remains uncertain.
Must-know Tip: Gartner analyst Michael Gabbard observed in 2025 that organizations discuss data’s value although “there are few who can substantiate it.” Define measurable results before creating dashboards. Judge success by improved decisions, not the quantity of charts.
Types of Data Visualization and How to Choose the Right Chart
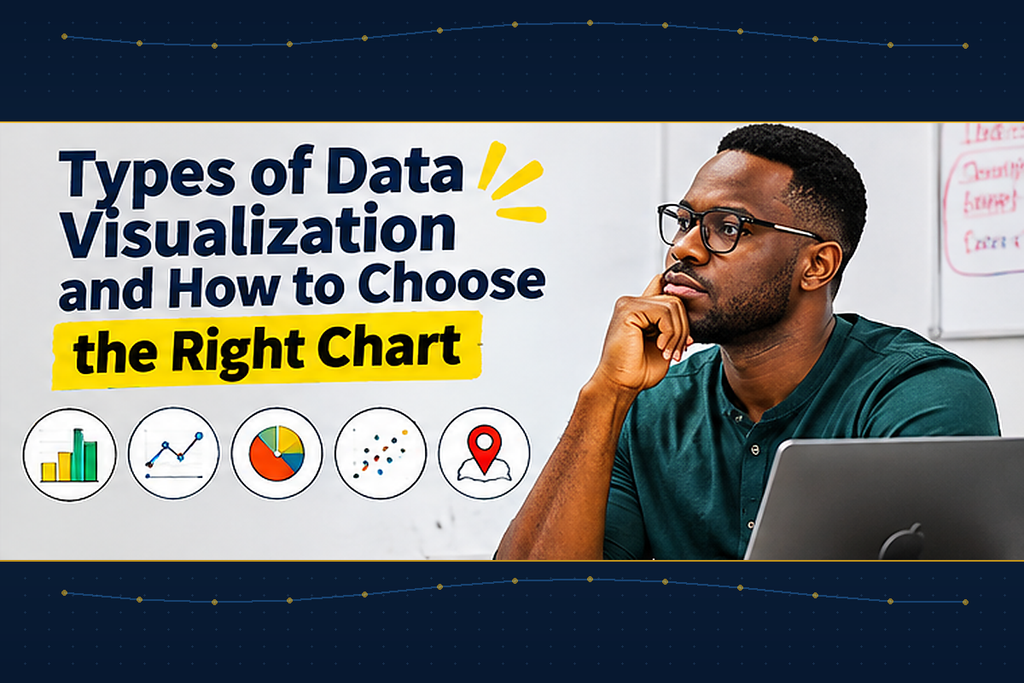
The best types of data visualization depend on your question. Some compare categories, others track trends, and others reveal distributions or relationships. Choosing by appearance alone risks confusing your audience.
Match these common charts to their tasks:
- Bar chart: Compare categories.
- Line chart: Track changes across dates.
- Histogram: Show numerical distributions.
- Scatter plot: Examine relationships between variables.
- Heat map: Highlight patterns in a matrix.
- Map: Show meaningful geographic variation.
Pie charts work for a few parts of one whole but become crowded with many slices. Tables suit readers who need precise figures. Dashboards may combine both, provided every view serves a purpose.
Avoid Misleading Comparisons
Bar charts should generally start at zero so small differences do not appear enormous. Line charts may use a narrower, labeled range for investigating small changes. With percentages, explain the denominator and disclose missing or overlapping categories.
Domo’s 2025 Data Never Sleeps 12.0 announcement reported 138.9 million Facebook and Instagram reel views per minute. You could compare that estimate with other online activity only when units and timeframes match. Otherwise, the comparison risks implying a relationship unsupported by the measurements.
Must-know Tip: Ask whether you need comparison, change, distribution, association, or location. Choose your chart only after answering. That order prevents common mistakes before readers encounter them.
How to Create Accurate and Accessible Data Visualizations
Begin before opening charting software. Write one question, identify your audience, and collect consistently defined information. If sales records mix refunds and completed orders, fix those definitions before comparing months.
Use this workflow for your first visualization:
- Define: State the question and intended decision.
- Collect: Gather reliable records over a fixed period.
- Clean: Resolve duplicates, gaps, and inconsistent labels.
- Analyze: Check totals, outliers, and group sizes.
- Design: Choose charts, labels, and fair scales.
- Review: Test accuracy, interpretation, and accessibility.
Polished charts can still conceal unreliable data. Salesforce’s 2025 research said data leaders estimated 26% of organizational data was untrustworthy. It also reported that 54% of business leaders were not fully confident the necessary data was accessible.
Check Accessibility, Bias, and Mobile Readability
Inspect what the graphic excludes as well as what it shows. Provide descriptions and underlying values, avoid color-only distinctions, and check contrast and labels. On phones, simplify crowded charts rather than shrinking desktop layouts into illegibility.
Correlation does not prove causation. Compare matching periods and populations, and flag missing regions or unusually small samples. Readers should know which conclusions are supported and which remain uncertain.
Must-know Tip: Ask an unfamiliar reader to explain the main finding. If they misunderstand the scale, legend, or comparison, revise it. You can test readability instead of assuming it.
Data Visualization Examples, Tools, and AI Trends
Useful data visualization examples link findings with actions. Retailers can compare returns, nonprofits can map demand, and marketers can examine conversion rates alongside spending. Build each graphic to investigate a problem, not merely fill space.
A Hypothetical Retail Case Study
Imagine Maya, an online home-goods retailer whose revenue looks healthy while profits shrink. She charts sales, shipping costs, and returns, discovering a popular category with costly returns. She investigates customer explanations and tests clearer product descriptions before evaluating whether costs improve.
This case is illustrative, not a documented result. The first chart reveals a pattern, and related information helps test explanations. Neither graph alone proves why products were returned.
Which Data Visualization Tools Should You Use?
Excel and Google Sheets suit simple charts, while Power BI and Tableau support richer dashboards. Python libraries such as Matplotlib and Plotly help with customized, repeatable analysis. Compare cost, learning effort, connections, privacy, and accessibility before choosing.
Stack Overflow reported in 2025 that Python usage grew seven percentage points from 2024. Its 2026 survey recorded Python use by 58.0% of respondents and SQL use by 58.4%. These measure surveyed developers, not visualization software market share.
AI can recommend visuals and summarize datasets, but errors remain possible. Stack Overflow’s 2025 survey found that 66% of developers were frustrated by AI outputs that were almost right. Verify generated formulas, calculations, and explanations against original records.
Conclusion
What is data visualization? It is the practice of turning trustworthy information into patterns people can examine and explain. Useful charts answer a question, make fair comparisons, and reveal their limitations.
You do not need expensive software to begin. Choose a small dataset, clean it, and create a chart addressing one practical question. Ask someone unfamiliar with the figures what they understand, then improve anything confusing.
As your work grows, you may introduce dashboards, maps, or automated reports. Keep privacy, accessibility, and interpretation central to every update. Aim for evidence-based decision-making rather than decoration or unquestioning trust in AI summaries.
An everyday spreadsheet may contain your next valuable insight. Ask what decision or explanation is missing, and let the data determine your visual format. The following answers cover common questions that can make your first project easier.
Frequently Asked Questions About Data Visualization
1. What is data visualization?
It is information presented visually. Charts and maps make patterns clearer. Good design serves understanding.
2. What are its four purposes?
They are idea generation, idea illustration, visual discovery, and everyday communication. Each has a purpose. Your audience guides the choice.
3. What types exist?
Examples include bars, lines, histograms, scatter plots, and maps. Each reveals different relationships. Choose according to your question.
4. What is an example?
A store charts monthly product returns. Staff spot an unusual increase. They investigate before changing policies.
5. Is visualization analytics?
No, analytics examines data to draw conclusions. Visualization helps investigate or communicate those findings. The two often work together.
6. Dashboard versus infographic?
Dashboards combine metrics for monitoring. Infographics explain selected information visually. Both need accuracy.
7. Can I avoid coding?
Yes, spreadsheets offer simple chart builders. Many dashboard platforms do too. Coding allows greater customization.
8. Which chart shows trends?
A line chart usually works best. Label intervals and units consistently. Separate incompatible measures when necessary.
9. Can charts mislead?
Yes, distorted scales and biased samples mislead. Missing context also changes interpretation. Always check underlying records.
10. Is my chart effective?
Ask readers to explain its message. Check whether they can make the intended comparison. Revise confusing elements.

Comments
0 responsesNo comments yet. Be the first to share your thoughts.